stability
Expand source code
import numpy as np import pyspark import sympy as sp from loguru import logger from pyspark.sql import DataFrame from pyspark.sql import functions as F from pyspark.sql import types as T from scipy.stats import variation from anovos.data_transformer.transformers import attribute_binning from anovos.shared.utils import attributeType_segregation from .validations import compute_si, check_metric_weightages, check_threshold def stability_index_computation( spark, idfs, list_of_cols="all", drop_cols=[], metric_weightages={"mean": 0.5, "stddev": 0.3, "kurtosis": 0.2}, binary_cols=[], existing_metric_path="", appended_metric_path="", persist: bool = True, persist_option=pyspark.StorageLevel.MEMORY_AND_DISK, threshold=1, print_impact=False, ): """ The data stability is represented by a single metric to summarise the stability of an attribute over multiple time periods. For example, given 6 datasets collected in 6 consecutive time periods (D1, D2, …, D6), data stability index of an attribute measures how stable the attribute is from D1 to D6. The major difference between data drift and data stability is that data drift analysis is only based on 2 datasets: source and target. However data stability analysis can be performed on multiple datasets. In addition, the source dataset is not required indicating that the stability index can be directly computed among multiple target datasets by comparing the statistical properties among them. In summary, given N datasets representing different time periods, we would like to measure the stability of some numerical attributes from the first to the N-th dataset. The whole process can be broken down into 2 steps: (1) Choose a few statistical metrics to describe the distribution of each attribute at each time period. (2) Compute attribute level stability by combining the stability of each statistical metric over time periods. In the first step, we choose mean, standard deviation and kurtosis as the statistical metrics in our implementation. Intuitively, they represent different aspects of a distribution: mean measures central tendency, standard deviation measures dispersion and kurtosis measures shape of a distribution. Reasons of selecting those 3 metrics will be explained in a later section. With mean, standard deviation and kurtosis computed for each attribute at each time interval, we can form 3 arrays of size N for each attribute. In the second step, Coefficient of Variation (CV) is used to measure the stability of each metric. CV represents the ratio of the standard deviation to the mean, which is a unitless statistic to compare the relative variation from one array to another. Considering the wide potential range of CV, the absolute value of CV is then mapped to an integer between 0 and 4 according to the table below, where 0 indicates highly unstable and 4 indicates highly stable. We call this integer a metric stability index. | abs(CV) Interval | Metric Stability Index | |------------------|------------------------| | [0, 0.03) | 4 | | [0.03, 0.1) | 3 | | [0.1, 0.2) | 2 | | [0.2, 0.5) | 1 | | [0.5, +inf) | 0 | Finally, the attribute stability index (SI) is a weighted sum of 3 metric stability indexes, where we assign 50% for mean, 30% for standard deviation and 20% for kurtosis by default. The final output is a float between 0 and 4 and an attribute can be classified as one of the following categories: very unstable (0≤SI<1), unstable (1≤SI<2), marginally stable (2≤SI<3), stable (3≤SI<3.5) and very stable (3.5≤SI≤4). For example, there are 6 samples of attribute X from T1 to T6. For each sample, we have computed the statistical metrics of X from T1 to T6: | idx | Mean | Standard deviation | Kurtosis | |-----|------|--------------------|----------| | 1 | 11 | 2 | 3.9 | | 2 | 12 | 1 | 4.2 | | 3 | 15 | 3 | 4.0 | | 4 | 10 | 2 | 4.1 | | 5 | 11 | 1 | 4.2 | | 6 | 13 | 0.5 | 4.0 | Then we calculate the Coefficient of Variation for each array: - CV of mean = CV([11, 12, 15, 10, 11, 13]) = 0.136 - CV of standard deviation = CV([2, 1, 3, 2, 1, 0.5]) = 0.529 - CV of kurtosis = CV([3.9, 4.2, 4.0, 4.1, 4.2, 4.0]) = 0.027 Metric stability indexes are then computed by mapping each CV value to an integer accordingly. As a result, metric stability index is 2 for mean, 0 for standard deviation and 4 for kurtosis. Why mean is chosen over median? - Dummy variables which take only the value 0 or 1 are frequently seen in machine learning features. Mean of a dummy variable represents the proportion of value 1 and median of a dummy variable is either 0 or 1 whichever is more frequent. However, CV may not work well when 0 appears in the array or the array contains both positive and negative values. For example, intuitively [0,0,0,0,0,1,0,0,0] is a stable array but its CV is 2.83 which is extremely high, but cv of [0.45,0.44,0.48,0.49,0.42,0.52,0.49,0.47,0.48] is 0.06 which is much more reasonable. Thus we decided to use mean instead of median. Although median is considered as a more robust choice, outlier treatment can be applied prior to data stability analysis to handle this issue. Why kurtosis is chosen over skewness? - Kurtosis is a positive value (note that we use kurtosis instead of excess kurtosis which) but skewness can range from –inf to +inf. Usually, if skewness is between -0.5 and 0.5, the distribution is approximately symmetric. Thus, if the skewness fluctuates around 0, the CV is highly likely to be high or invalid because the mean will be close to 0. Stability index is preferred in the following scenario: - Pairwise drift analysis can be performed between the source dataset and each of the target dataset to quantify the drift over time. However this can be time-consuming especially when the number of target dataset is large. In this case, measuring data stability instead of data drift would be a much faster alternative and the source/baseline dataset is not required as well Troubleshooting - If the attribute stability index appears to be nan, it may due to one of the following reasons: - One metric ( likely to be kurtosis) is nan. For example, the kurtosis of a sample is nan If its standard deviation is 0. - The mean of a metric from the first to the N-th dataset is zero, causing the denominator of CV to be 0. For example, when mean of attribute X is always zero for all datasets, its stability index would be nan. Limitation - Limitation of CV: CV may not work well when 0 appears in the array or the array contains both positive and negative values. Parameters ---------- spark Spark Session idfs Variable number of input dataframes list_of_cols List of numerical columns to check stability e.g., ["col1","col2"]. Alternatively, columns can be specified in a string format, where different column names are separated by pipe delimiter “|” e.g., "col1|col2". "all" can be passed to include all numerical columns for analysis. Please note that this argument is used in conjunction with drop_cols i.e. a column mentioned in drop_cols argument is not considered for analysis even if it is mentioned in list_of_cols. (Default value = "all") drop_cols List of columns to be dropped e.g., ["col1","col2"]. Alternatively, columns can be specified in a string format, where different column names are separated by pipe delimiter “|” e.g., "col1|col2". (Default value = []) metric_weightages Takes input in dictionary format with keys being the metric name - "mean","stdev","kurtosis" and value being the weightage of the metric (between 0 and 1). Sum of all weightages must be 1. (Default value = {"mean": 0.5, "stddev": 0.3, "kurtosis": 0.2}) binary_cols List of numerical columns to be treated as binary columns e.g., ["col1","col2"]. Alternatively, columns can be specified in a string format, where different column names are separated by pipe delimiter “|”. For the specified binary columns, only the mean value will be used as the statistical metric (standard deviation and kurtosis will be skipped). In addition, standard deviation will be used to measure the stability of mean instead of CV. (Default value = []) existing_metric_path This argument is path for referring pre-existing metrics of historical datasets and is of schema [idx, attribute, mean, stdev, kurtosis]. idx is index number of historical datasets assigned in chronological order. (Default value = "") appended_metric_path This argument is path for saving input dataframes metrics after appending to the historical datasets' metrics. (Default value = "") persist Boolean argument - True or False. This argument is used to determine whether to persist on binning result of source and target dataset, True will enable the use of persist, otherwise False. It is recommended to set this as True for large datasets. (Default value = True) persist_option If persist is True, this argument is used to determine the type of persist. (Default value = pyspark.StorageLevel.MEMORY_AND_DISK) threshold A column is flagged if the stability index is below the threshold, which varies between 0 to 4. The following criteria can be used to classifiy stability_index (SI): very unstable: 0≤SI<1, unstable: 1≤SI<2, marginally stable: 2≤SI<3, stable: 3≤SI<3.5 and very stable: 3.5≤SI≤4. (Default value = 1) print_impact True, False (Default value = False) This argument is to print out the stability metrics of all attributes and potential unstable attributes. Returns ------- DataFrame [attribute, mean_stddev, mean_si, stddev_si, kurtosis_si, mean_cv, stddev_cv, kurtosis_cv, stability_index]. *_cv is coefficient of variation for each metric. *_si is stability index for each metric. stability_index is net weighted stability index based on the individual metrics' stability index. """ num_cols = attributeType_segregation(idfs[0])[0] if list_of_cols == "all": list_of_cols = num_cols if isinstance(list_of_cols, str): list_of_cols = [x.strip() for x in list_of_cols.split("|")] if isinstance(drop_cols, str): drop_cols = [x.strip() for x in drop_cols.split("|")] if isinstance(binary_cols, str): binary_cols = [x.strip() for x in binary_cols.split("|")] list_of_cols = list(set([e for e in list_of_cols if e not in drop_cols])) if any(x not in num_cols for x in list_of_cols) | (len(list_of_cols) == 0): raise TypeError("Invalid input for Column(s)") if any(x not in list_of_cols for x in binary_cols): raise TypeError("Invalid input for Binary Column(s)") check_metric_weightages(metric_weightages) check_threshold(threshold) if existing_metric_path: existing_metric_df = spark.read.csv( existing_metric_path, header=True, inferSchema=True ) dfs_count = int(existing_metric_df.select(F.max(F.col("idx"))).first()[0]) + 1 else: existing_metric_df = None dfs_count = 1 def unionAll(dfs): first, *_ = dfs return first.sql_ctx.createDataFrame( first.sql_ctx._sc.union([df.rdd for df in dfs]), first.schema ) if persist: for i in range(len(idfs)): idfs[i] = idfs[i].select(list_of_cols) idfs[i].persist(persist_option) list_temp_all_col = [] if appended_metric_path: list_append_all = [] for i in list_of_cols: if i in binary_cols: col_type = "Binary" else: col_type = "Numerical" count_idf = dfs_count list_temp_col_in_idf = [] for idf in idfs: df_stat_each = idf.select( F.mean(i).alias("mean"), F.stddev(i).alias("stddev"), (F.kurtosis(i) + F.lit(3)).alias("kurtosis"), ) list_temp_col_in_idf.append(df_stat_each) if appended_metric_path: df_append_single = df_stat_each.select( F.lit(str(count_idf)).alias("idx"), F.lit(str(i)).alias("attribute"), F.lit(col_type).alias("type"), "mean", "stddev", "kurtosis", ) list_append_all.append(df_append_single) count_idf += 1 if existing_metric_df: existing_df_for_single_col = existing_metric_df.where( F.col("attribute") == str(i) ).select("mean", "stddev", "kurtosis") if existing_df_for_single_col.count() > 0: list_temp_col_in_idf.append(existing_df_for_single_col) df_stat_col = ( unionAll(list_temp_col_in_idf) .select( F.stddev("mean").alias("std_of_mean"), F.mean("mean").alias("mean_of_mean"), F.stddev("stddev").alias("std_of_stddev"), F.mean("stddev").alias("mean_of_stddev"), F.stddev("kurtosis").alias("std_of_kurtosis"), F.mean("kurtosis").alias("mean_of_kurtosis"), ) .select( F.lit(str(i)).alias("attribute"), F.lit(col_type).alias("type"), F.col("std_of_mean").alias("mean_stddev"), (F.col("std_of_mean") / F.col("mean_of_mean")).alias("mean_cv"), (F.col("std_of_stddev") / F.col("mean_of_stddev")).alias("stddev_cv"), (F.col("std_of_kurtosis") / F.col("mean_of_kurtosis")).alias( "kurtosis_cv" ), ) ) list_temp_all_col.append(df_stat_col) odf = unionAll(list_temp_all_col) if appended_metric_path: if existing_metric_df: list_append_all.append(existing_metric_df) df_append = unionAll(list_append_all).orderBy(F.col("idx")) df_append.coalesce(1).write.csv( appended_metric_path, header=True, mode="overwrite" ) f_compute_si = F.udf(compute_si(metric_weightages), T.ArrayType(T.FloatType())) odf = ( odf.replace(np.nan, None) .withColumn( "si_array", f_compute_si("type", "mean_stddev", "mean_cv", "stddev_cv", "kurtosis_cv"), ) .withColumn("mean_si", F.col("si_array").getItem(0)) .withColumn("stddev_si", F.col("si_array").getItem(1)) .withColumn("kurtosis_si", F.col("si_array").getItem(2)) .withColumn("stability_index", F.col("si_array").getItem(3)) .withColumn( "flagged", F.when( (F.col("stability_index") < threshold) | (F.col("stability_index").isNull()), 1, ).otherwise(0), ) .withColumn("mean_stddev", F.round(F.col("mean_stddev"), 4)) .withColumn("mean_cv", F.round(F.col("mean_cv"), 4)) .withColumn("stddev_cv", F.round(F.col("stddev_cv"), 4)) .withColumn("kurtosis_cv", F.round(F.col("kurtosis_cv"), 4)) .drop("si_array") ) if print_impact: logger.info("All Attributes:") odf.show(len(list_of_cols)) logger.info("Potential Unstable Attributes:") unstable = odf.where(F.col("flagged") == 1) unstable.show(unstable.count()) if persist: for i in range(len(idfs)): idfs[i].unpersist() return odf def feature_stability_estimation( spark, attribute_stats, attribute_transformation, metric_weightages={"mean": 0.5, "stddev": 0.3, "kurtosis": 0.2}, threshold=1, print_impact=False, ): """ This function is able to estimate the stability index of a new feature composed of certain attributes whose stability metrics are known. For example, the new feature F can be expressed as F = g(X1, X2, …, Xn), where X1, X2, …, Xn represent different attributes and g represents the transformation function. The most straightforward way is to generate the new feature for all periods and calculate its stability index. However, it requires reading all historical data again which can be unrealistic for large datasets. Thus, the objective of this function is to estimate feature stability index without reading historical data. One example can be the following scenario: we have attributes A and B, we have their respective stability statistics from T1 to T7. At T7 we realise we need to generate a new feature: A/B, but we don’t have statistics metrics of A/B from T1 to T6 and this is where this function can be applied to generate an estimation without reading datasets from T1 to T6. The estimation can be broken down into 3 steps. 1. Estimate mean and stddev for the new feature based on attribute metrics (no existing resource found to estimate Feature kurtosis). Estimated mean and stddev are generated for each time period using the formula below according to [1]: 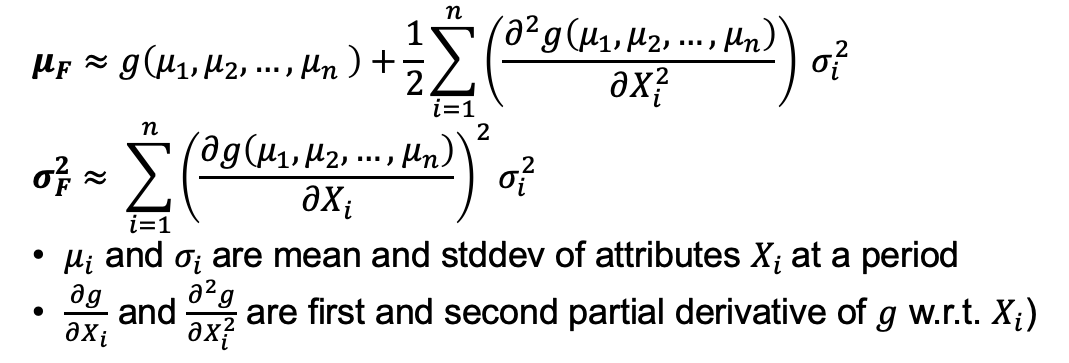 2. Calculate Coefficient of variation (CV) for estimated feature mean and stddev. Each CV can be then mapped to an integer between 0 and 4 to generate the metric stability index. 3. Similar to the attribute stability index, each metric is assigned a weightage between 0 and 1, where the default values are 50 for mean, 30% for standard deviation and 20% for kurtosis. Because we are unable to generate kurtosis stability index, its minimum and maximum possible values (0 and 4) are used to output a range for global stability index (GSI): * Lower bound of GSI = 0.5∗mean stability index + 0.3∗stddev stability index + 0.2 ∗ 𝟎 * Upper bound of GSI = 0.5∗mean stability index + 0.3∗stddev stability index + 0.2 ∗ 𝟒 [1] Benaroya, H., Han, S. M., & Nagurka, M. (2005). Probability models in engineering and science (Vol. 192, pp. 168-169). CRC press. Parameters ---------- spark Spark Session attribute_stats Spark dataframe. The intermediate dataframe saved by running function stabilityIndex_computation with schema [idx, attribute, mean, stddev, kurtosis]. It should contain all the attributes used in argument attribute_transformation. attribute_transformation Takes input in dictionary format: each key-value combination represents one new feature. Each key is a string containing all the attributes involved in the new feature seperated by '|'. Each value is the transformation of the attributes in string. For example, {'X|Y|Z': 'X**2+Y/Z', 'A': 'log(A)'} metric_weightages Takes input in dictionary format with keys being the metric name - "mean","stdev","kurtosis" and value being the weightage of the metric (between 0 and 1). Sum of all weightages must be 1. (Default value = {"mean": 0.5, "stddev": 0.3, "kurtosis": 0.2}) threshold A column is flagged if the stability index is below the threshold, which varies between 0 and 4. The following criteria can be used to classify stability_index (SI): very unstable: 0≤SI<1, unstable: 1≤SI<2, marginally stable: 2≤SI<3, stable: 3≤SI<3.5 and very stable: 3.5≤SI≤4. (Default value = 1) print_impact True, False (Default value = False) This argument is to print out the stability metrics of all newly generated features and potential unstable features. Returns ------- DataFrame [feature_formula, mean_cv, stddev_cv, mean_si, stddev_si, stability_index_lower_bound, stability_index_upper_bound, flagged_lower, flagged_upper]. *_cv is coefficient of variation for each metric. *_si is stability index for each metric. stability_index_lower_bound and stability_index_upper_bound form a range for estimated stability index. flagged_lower and flagged_upper indicate whether the feature is potentially unstable based on the lower and upper bounds for stability index. """ if ( round( metric_weightages.get("mean", 0) + metric_weightages.get("stddev", 0) + metric_weightages.get("kurtosis", 0), 3, ) != 1 ): raise ValueError( "Invalid input for metric weightages. Either metric name is incorrect or sum of metric weightages is not 1.0." ) def stats_estimation(attributes, transformation, mean, stddev): attribute_means = list(zip(attributes, mean)) first_dev = [] second_dev = [] est_mean = 0 est_var = 0 for attr, s in zip(attributes, stddev): first_dev = sp.diff(transformation, attr) second_dev = sp.diff(transformation, attr, 2) est_mean += s**2 * second_dev.subs(attribute_means) / 2 est_var += s**2 * (first_dev.subs(attribute_means)) ** 2 transformation = sp.parse_expr(transformation) est_mean += transformation.subs(attribute_means) return [float(est_mean), float(est_var)] f_stats_estimation = F.udf(stats_estimation, T.ArrayType(T.FloatType())) index = ( attribute_stats.select("idx") .distinct() .orderBy("idx") .rdd.flatMap(list) .collect() ) attribute_names = list(attribute_transformation.keys()) transformations = list(attribute_transformation.values()) feature_metric = [] for attributes, transformation in zip(attribute_names, transformations): attributes = [x.strip() for x in attributes.split("|")] for idx in index: attr_mean_list, attr_stddev_list = [], [] for attr in attributes: df_temp = attribute_stats.where( (F.col("idx") == idx) & (F.col("attribute") == attr) ) if df_temp.count() == 0: raise TypeError( "Invalid input for attribute_stats: all involved attributes must have available statistics across all time periods (idx)" ) attr_mean_list.append( df_temp.select("mean").rdd.flatMap(lambda x: x).collect()[0] ) attr_stddev_list.append( df_temp.select("stddev").rdd.flatMap(lambda x: x).collect()[0] ) feature_metric.append( [idx, transformation, attributes, attr_mean_list, attr_stddev_list] ) schema = T.StructType( [ T.StructField("idx", T.IntegerType(), True), T.StructField("transformation", T.StringType(), True), T.StructField("attributes", T.ArrayType(T.StringType()), True), T.StructField("attr_mean_list", T.ArrayType(T.FloatType()), True), T.StructField("attr_stddev_list", T.ArrayType(T.FloatType()), True), ] ) df_feature_metric = ( spark.createDataFrame(feature_metric, schema=schema) .withColumn( "est_feature_stats", f_stats_estimation( "attributes", "transformation", "attr_mean_list", "attr_stddev_list" ), ) .withColumn("est_feature_mean", F.col("est_feature_stats")[0]) .withColumn("est_feature_stddev", F.sqrt(F.col("est_feature_stats")[1])) .select( "idx", "attributes", "transformation", "est_feature_mean", "est_feature_stddev", ) ) output = [] for idx, i in enumerate(transformations): i_output = [i] for metric in ["est_feature_mean", "est_feature_stddev"]: metric_stats = ( df_feature_metric.where(F.col("transformation") == i) .orderBy("idx") .select(metric) .fillna(np.nan) .rdd.flatMap(list) .collect() ) metric_cv = round(float(variation([a for a in metric_stats])), 4) i_output.append(metric_cv) output.append(i_output) schema = T.StructType( [ T.StructField("feature_formula", T.StringType(), True), T.StructField("mean_cv", T.FloatType(), True), T.StructField("stddev_cv", T.FloatType(), True), ] ) odf = spark.createDataFrame(output, schema=schema) def score_cv(cv, thresholds=[0.03, 0.1, 0.2, 0.5]): if cv is None: return None else: cv = abs(cv) stability_index = [4, 3, 2, 1, 0] for i, thresh in enumerate(thresholds): if cv < thresh: return stability_index[i] return stability_index[-1] f_score_cv = F.udf(score_cv, T.IntegerType()) odf = ( odf.replace(np.nan, None) .withColumn("mean_si", f_score_cv(F.col("mean_cv"))) .withColumn("stddev_si", f_score_cv(F.col("stddev_cv"))) .withColumn( "stability_index_lower_bound", F.round( F.col("mean_si") * metric_weightages.get("mean", 0) + F.col("stddev_si") * metric_weightages.get("stddev", 0), 4, ), ) .withColumn( "stability_index_upper_bound", F.round( F.col("stability_index_lower_bound") + 4 * metric_weightages.get("kurtosis", 0), 4, ), ) .withColumn( "flagged_lower", F.when( (F.col("stability_index_lower_bound") < threshold) | (F.col("stability_index_lower_bound").isNull()), 1, ).otherwise(0), ) .withColumn( "flagged_upper", F.when( (F.col("stability_index_upper_bound") < threshold) | (F.col("stability_index_upper_bound").isNull()), 1, ).otherwise(0), ) ) if print_impact: logger.info("All Features:") odf.show(len(attribute_names), False) logger.info( "Potential Unstable Features Identified by Both Lower and Upper Bounds:" ) unstable = odf.where(F.col("flagged_upper") == 1) unstable.show(unstable.count()) return odf
Functions
def feature_stability_estimation(spark, attribute_stats, attribute_transformation, metric_weightages={'mean': 0.5, 'stddev': 0.3, 'kurtosis': 0.2}, threshold=1, print_impact=False)-
This function is able to estimate the stability index of a new feature composed of certain attributes whose stability metrics are known. For example, the new feature F can be expressed as F = g(X1, X2, …, Xn), where X1, X2, …, Xn represent different attributes and g represents the transformation function. The most straightforward way is to generate the new feature for all periods and calculate its stability index. However, it requires reading all historical data again which can be unrealistic for large datasets. Thus, the objective of this function is to estimate feature stability index without reading historical data.
One example can be the following scenario: we have attributes A and B, we have their respective stability statistics from T1 to T7. At T7 we realise we need to generate a new feature: A/B, but we don’t have statistics metrics of A/B from T1 to T6 and this is where this function can be applied to generate an estimation without reading datasets from T1 to T6.
The estimation can be broken down into 3 steps. 1. Estimate mean and stddev for the new feature based on attribute metrics (no existing resource found to estimate Feature kurtosis). Estimated mean and stddev are generated for each time period using the formula below according to [1]:
 2. Calculate Coefficient of variation (CV) for estimated feature mean and stddev. Each CV can be then mapped
to an integer between 0 and 4 to generate the metric stability index.
3. Similar to the attribute stability index, each metric is assigned a weightage between 0 and 1, where the
default values are 50 for mean, 30% for standard deviation and 20% for kurtosis. Because we are unable to
generate kurtosis stability index, its minimum and maximum possible values (0 and 4) are used to output a
range for global stability index (GSI):
* Lower bound of GSI = 0.5∗mean stability index + 0.3∗stddev stability index + 0.2 ∗ 𝟎
* Upper bound of GSI = 0.5∗mean stability index + 0.3∗stddev stability index + 0.2 ∗ 𝟒
2. Calculate Coefficient of variation (CV) for estimated feature mean and stddev. Each CV can be then mapped
to an integer between 0 and 4 to generate the metric stability index.
3. Similar to the attribute stability index, each metric is assigned a weightage between 0 and 1, where the
default values are 50 for mean, 30% for standard deviation and 20% for kurtosis. Because we are unable to
generate kurtosis stability index, its minimum and maximum possible values (0 and 4) are used to output a
range for global stability index (GSI):
* Lower bound of GSI = 0.5∗mean stability index + 0.3∗stddev stability index + 0.2 ∗ 𝟎
* Upper bound of GSI = 0.5∗mean stability index + 0.3∗stddev stability index + 0.2 ∗ 𝟒[1] Benaroya, H., Han, S. M., & Nagurka, M. (2005). Probability models in engineering and science (Vol. 192, pp. 168-169). CRC press.
Parameters
spark- Spark Session
attribute_stats- Spark dataframe. The intermediate dataframe saved by running function stabilityIndex_computation with schema [idx, attribute, mean, stddev, kurtosis]. It should contain all the attributes used in argument attribute_transformation.
attribute_transformation- Takes input in dictionary format: each key-value combination represents one new feature. Each key is a string containing all the attributes involved in the new feature seperated by '|'. Each value is the transformation of the attributes in string. For example, {'X|Y|Z': 'X**2+Y/Z', 'A': 'log(A)'}
metric_weightages- Takes input in dictionary format with keys being the metric name - "mean","stdev","kurtosis" and value being the weightage of the metric (between 0 and 1). Sum of all weightages must be 1. (Default value = {"mean": 0.5, "stddev": 0.3, "kurtosis": 0.2})
threshold- A column is flagged if the stability index is below the threshold, which varies between 0 and 4. The following criteria can be used to classify stability_index (SI): very unstable: 0≤SI<1, unstable: 1≤SI<2, marginally stable: 2≤SI<3, stable: 3≤SI<3.5 and very stable: 3.5≤SI≤4. (Default value = 1)
print_impact- True, False (Default value = False) This argument is to print out the stability metrics of all newly generated features and potential unstable features.
Returns
DataFrame- [feature_formula, mean_cv, stddev_cv, mean_si, stddev_si, stability_index_lower_bound, stability_index_upper_bound, flagged_lower, flagged_upper]. _cv is coefficient of variation for each metric. _si is stability index for each metric. stability_index_lower_bound and stability_index_upper_bound form a range for estimated stability index. flagged_lower and flagged_upper indicate whether the feature is potentially unstable based on the lower and upper bounds for stability index.
Expand source code
def feature_stability_estimation( spark, attribute_stats, attribute_transformation, metric_weightages={"mean": 0.5, "stddev": 0.3, "kurtosis": 0.2}, threshold=1, print_impact=False, ): """ This function is able to estimate the stability index of a new feature composed of certain attributes whose stability metrics are known. For example, the new feature F can be expressed as F = g(X1, X2, …, Xn), where X1, X2, …, Xn represent different attributes and g represents the transformation function. The most straightforward way is to generate the new feature for all periods and calculate its stability index. However, it requires reading all historical data again which can be unrealistic for large datasets. Thus, the objective of this function is to estimate feature stability index without reading historical data. One example can be the following scenario: we have attributes A and B, we have their respective stability statistics from T1 to T7. At T7 we realise we need to generate a new feature: A/B, but we don’t have statistics metrics of A/B from T1 to T6 and this is where this function can be applied to generate an estimation without reading datasets from T1 to T6. The estimation can be broken down into 3 steps. 1. Estimate mean and stddev for the new feature based on attribute metrics (no existing resource found to estimate Feature kurtosis). Estimated mean and stddev are generated for each time period using the formula below according to [1]:  2. Calculate Coefficient of variation (CV) for estimated feature mean and stddev. Each CV can be then mapped to an integer between 0 and 4 to generate the metric stability index. 3. Similar to the attribute stability index, each metric is assigned a weightage between 0 and 1, where the default values are 50 for mean, 30% for standard deviation and 20% for kurtosis. Because we are unable to generate kurtosis stability index, its minimum and maximum possible values (0 and 4) are used to output a range for global stability index (GSI): * Lower bound of GSI = 0.5∗mean stability index + 0.3∗stddev stability index + 0.2 ∗ 𝟎 * Upper bound of GSI = 0.5∗mean stability index + 0.3∗stddev stability index + 0.2 ∗ 𝟒 [1] Benaroya, H., Han, S. M., & Nagurka, M. (2005). Probability models in engineering and science (Vol. 192, pp. 168-169). CRC press. Parameters ---------- spark Spark Session attribute_stats Spark dataframe. The intermediate dataframe saved by running function stabilityIndex_computation with schema [idx, attribute, mean, stddev, kurtosis]. It should contain all the attributes used in argument attribute_transformation. attribute_transformation Takes input in dictionary format: each key-value combination represents one new feature. Each key is a string containing all the attributes involved in the new feature seperated by '|'. Each value is the transformation of the attributes in string. For example, {'X|Y|Z': 'X**2+Y/Z', 'A': 'log(A)'} metric_weightages Takes input in dictionary format with keys being the metric name - "mean","stdev","kurtosis" and value being the weightage of the metric (between 0 and 1). Sum of all weightages must be 1. (Default value = {"mean": 0.5, "stddev": 0.3, "kurtosis": 0.2}) threshold A column is flagged if the stability index is below the threshold, which varies between 0 and 4. The following criteria can be used to classify stability_index (SI): very unstable: 0≤SI<1, unstable: 1≤SI<2, marginally stable: 2≤SI<3, stable: 3≤SI<3.5 and very stable: 3.5≤SI≤4. (Default value = 1) print_impact True, False (Default value = False) This argument is to print out the stability metrics of all newly generated features and potential unstable features. Returns ------- DataFrame [feature_formula, mean_cv, stddev_cv, mean_si, stddev_si, stability_index_lower_bound, stability_index_upper_bound, flagged_lower, flagged_upper]. *_cv is coefficient of variation for each metric. *_si is stability index for each metric. stability_index_lower_bound and stability_index_upper_bound form a range for estimated stability index. flagged_lower and flagged_upper indicate whether the feature is potentially unstable based on the lower and upper bounds for stability index. """ if ( round( metric_weightages.get("mean", 0) + metric_weightages.get("stddev", 0) + metric_weightages.get("kurtosis", 0), 3, ) != 1 ): raise ValueError( "Invalid input for metric weightages. Either metric name is incorrect or sum of metric weightages is not 1.0." ) def stats_estimation(attributes, transformation, mean, stddev): attribute_means = list(zip(attributes, mean)) first_dev = [] second_dev = [] est_mean = 0 est_var = 0 for attr, s in zip(attributes, stddev): first_dev = sp.diff(transformation, attr) second_dev = sp.diff(transformation, attr, 2) est_mean += s**2 * second_dev.subs(attribute_means) / 2 est_var += s**2 * (first_dev.subs(attribute_means)) ** 2 transformation = sp.parse_expr(transformation) est_mean += transformation.subs(attribute_means) return [float(est_mean), float(est_var)] f_stats_estimation = F.udf(stats_estimation, T.ArrayType(T.FloatType())) index = ( attribute_stats.select("idx") .distinct() .orderBy("idx") .rdd.flatMap(list) .collect() ) attribute_names = list(attribute_transformation.keys()) transformations = list(attribute_transformation.values()) feature_metric = [] for attributes, transformation in zip(attribute_names, transformations): attributes = [x.strip() for x in attributes.split("|")] for idx in index: attr_mean_list, attr_stddev_list = [], [] for attr in attributes: df_temp = attribute_stats.where( (F.col("idx") == idx) & (F.col("attribute") == attr) ) if df_temp.count() == 0: raise TypeError( "Invalid input for attribute_stats: all involved attributes must have available statistics across all time periods (idx)" ) attr_mean_list.append( df_temp.select("mean").rdd.flatMap(lambda x: x).collect()[0] ) attr_stddev_list.append( df_temp.select("stddev").rdd.flatMap(lambda x: x).collect()[0] ) feature_metric.append( [idx, transformation, attributes, attr_mean_list, attr_stddev_list] ) schema = T.StructType( [ T.StructField("idx", T.IntegerType(), True), T.StructField("transformation", T.StringType(), True), T.StructField("attributes", T.ArrayType(T.StringType()), True), T.StructField("attr_mean_list", T.ArrayType(T.FloatType()), True), T.StructField("attr_stddev_list", T.ArrayType(T.FloatType()), True), ] ) df_feature_metric = ( spark.createDataFrame(feature_metric, schema=schema) .withColumn( "est_feature_stats", f_stats_estimation( "attributes", "transformation", "attr_mean_list", "attr_stddev_list" ), ) .withColumn("est_feature_mean", F.col("est_feature_stats")[0]) .withColumn("est_feature_stddev", F.sqrt(F.col("est_feature_stats")[1])) .select( "idx", "attributes", "transformation", "est_feature_mean", "est_feature_stddev", ) ) output = [] for idx, i in enumerate(transformations): i_output = [i] for metric in ["est_feature_mean", "est_feature_stddev"]: metric_stats = ( df_feature_metric.where(F.col("transformation") == i) .orderBy("idx") .select(metric) .fillna(np.nan) .rdd.flatMap(list) .collect() ) metric_cv = round(float(variation([a for a in metric_stats])), 4) i_output.append(metric_cv) output.append(i_output) schema = T.StructType( [ T.StructField("feature_formula", T.StringType(), True), T.StructField("mean_cv", T.FloatType(), True), T.StructField("stddev_cv", T.FloatType(), True), ] ) odf = spark.createDataFrame(output, schema=schema) def score_cv(cv, thresholds=[0.03, 0.1, 0.2, 0.5]): if cv is None: return None else: cv = abs(cv) stability_index = [4, 3, 2, 1, 0] for i, thresh in enumerate(thresholds): if cv < thresh: return stability_index[i] return stability_index[-1] f_score_cv = F.udf(score_cv, T.IntegerType()) odf = ( odf.replace(np.nan, None) .withColumn("mean_si", f_score_cv(F.col("mean_cv"))) .withColumn("stddev_si", f_score_cv(F.col("stddev_cv"))) .withColumn( "stability_index_lower_bound", F.round( F.col("mean_si") * metric_weightages.get("mean", 0) + F.col("stddev_si") * metric_weightages.get("stddev", 0), 4, ), ) .withColumn( "stability_index_upper_bound", F.round( F.col("stability_index_lower_bound") + 4 * metric_weightages.get("kurtosis", 0), 4, ), ) .withColumn( "flagged_lower", F.when( (F.col("stability_index_lower_bound") < threshold) | (F.col("stability_index_lower_bound").isNull()), 1, ).otherwise(0), ) .withColumn( "flagged_upper", F.when( (F.col("stability_index_upper_bound") < threshold) | (F.col("stability_index_upper_bound").isNull()), 1, ).otherwise(0), ) ) if print_impact: logger.info("All Features:") odf.show(len(attribute_names), False) logger.info( "Potential Unstable Features Identified by Both Lower and Upper Bounds:" ) unstable = odf.where(F.col("flagged_upper") == 1) unstable.show(unstable.count()) return odf def stability_index_computation(spark, idfs, list_of_cols='all', drop_cols=[], metric_weightages={'mean': 0.5, 'stddev': 0.3, 'kurtosis': 0.2}, binary_cols=[], existing_metric_path='', appended_metric_path='', persist: bool = True, persist_option=StorageLevel(True, True, False, False, 1), threshold=1, print_impact=False)-
The data stability is represented by a single metric to summarise the stability of an attribute over multiple time periods. For example, given 6 datasets collected in 6 consecutive time periods (D1, D2, …, D6), data stability index of an attribute measures how stable the attribute is from D1 to D6.
The major difference between data drift and data stability is that data drift analysis is only based on 2 datasets: source and target. However data stability analysis can be performed on multiple datasets. In addition, the source dataset is not required indicating that the stability index can be directly computed among multiple target datasets by comparing the statistical properties among them.
In summary, given N datasets representing different time periods, we would like to measure the stability of some numerical attributes from the first to the N-th dataset.
The whole process can be broken down into 2 steps: (1) Choose a few statistical metrics to describe the distribution of each attribute at each time period. (2) Compute attribute level stability by combining the stability of each statistical metric over time periods.
In the first step, we choose mean, standard deviation and kurtosis as the statistical metrics in our implementation. Intuitively, they represent different aspects of a distribution: mean measures central tendency, standard deviation measures dispersion and kurtosis measures shape of a distribution. Reasons of selecting those 3 metrics will be explained in a later section. With mean, standard deviation and kurtosis computed for each attribute at each time interval, we can form 3 arrays of size N for each attribute.
In the second step, Coefficient of Variation (CV) is used to measure the stability of each metric. CV represents the ratio of the standard deviation to the mean, which is a unitless statistic to compare the relative variation from one array to another. Considering the wide potential range of CV, the absolute value of CV is then mapped to an integer between 0 and 4 according to the table below, where 0 indicates highly unstable and 4 indicates highly stable. We call this integer a metric stability index.
abs(CV) Interval Metric Stability Index [0, 0.03) 4 [0.03, 0.1) 3 [0.1, 0.2) 2 [0.2, 0.5) 1 [0.5, +inf) 0 Finally, the attribute stability index (SI) is a weighted sum of 3 metric stability indexes, where we assign 50% for mean, 30% for standard deviation and 20% for kurtosis by default. The final output is a float between 0 and 4 and an attribute can be classified as one of the following categories: very unstable (0≤SI<1), unstable (1≤SI<2), marginally stable (2≤SI<3), stable (3≤SI<3.5) and very stable (3.5≤SI≤4).
For example, there are 6 samples of attribute X from T1 to T6. For each sample, we have computed the statistical metrics of X from T1 to T6:
idx Mean Standard deviation Kurtosis 1 11 2 3.9 2 12 1 4.2 3 15 3 4.0 4 10 2 4.1 5 11 1 4.2 6 13 0.5 4.0 Then we calculate the Coefficient of Variation for each array:
- CV of mean = CV([11, 12, 15, 10, 11, 13]) = 0.136
- CV of standard deviation = CV([2, 1, 3, 2, 1, 0.5]) = 0.529
- CV of kurtosis = CV([3.9, 4.2, 4.0, 4.1, 4.2, 4.0]) = 0.027
Metric stability indexes are then computed by mapping each CV value to an integer accordingly. As a result, metric stability index is 2 for mean, 0 for standard deviation and 4 for kurtosis.
Why mean is chosen over median?
- Dummy variables which take only the value 0 or 1 are frequently seen in machine learning features. Mean of a dummy variable represents the proportion of value 1 and median of a dummy variable is either 0 or 1 whichever is more frequent. However, CV may not work well when 0 appears in the array or the array contains both positive and negative values. For example, intuitively [0,0,0,0,0,1,0,0,0] is a stable array but its CV is 2.83 which is extremely high, but cv of [0.45,0.44,0.48,0.49,0.42,0.52,0.49,0.47,0.48] is 0.06 which is much more reasonable. Thus we decided to use mean instead of median. Although median is considered as a more robust choice, outlier treatment can be applied prior to data stability analysis to handle this issue.
Why kurtosis is chosen over skewness?
- Kurtosis is a positive value (note that we use kurtosis instead of excess kurtosis which) but skewness can range from –inf to +inf. Usually, if skewness is between -0.5 and 0.5, the distribution is approximately symmetric. Thus, if the skewness fluctuates around 0, the CV is highly likely to be high or invalid because the mean will be close to 0.
Stability index is preferred in the following scenario:
- Pairwise drift analysis can be performed between the source dataset and each of the target dataset to quantify the drift over time. However this can be time-consuming especially when the number of target dataset is large. In this case, measuring data stability instead of data drift would be a much faster alternative and the source/baseline dataset is not required as well
Troubleshooting
- If the attribute stability index appears to be nan, it may due to one of the following reasons: - One metric ( likely to be kurtosis) is nan. For example, the kurtosis of a sample is nan If its standard deviation is 0. - The mean of a metric from the first to the N-th dataset is zero, causing the denominator of CV to be 0. For example, when mean of attribute X is always zero for all datasets, its stability index would be nan.
Limitation
- Limitation of CV: CV may not work well when 0 appears in the array or the array contains both positive and negative values.
Parameters
spark- Spark Session
idfs- Variable number of input dataframes
list_of_cols- List of numerical columns to check stability e.g., ["col1","col2"]. Alternatively, columns can be specified in a string format, where different column names are separated by pipe delimiter “|” e.g., "col1|col2". "all" can be passed to include all numerical columns for analysis. Please note that this argument is used in conjunction with drop_cols i.e. a column mentioned in drop_cols argument is not considered for analysis even if it is mentioned in list_of_cols. (Default value = "all")
drop_cols- List of columns to be dropped e.g., ["col1","col2"]. Alternatively, columns can be specified in a string format, where different column names are separated by pipe delimiter “|” e.g., "col1|col2". (Default value = [])
metric_weightages- Takes input in dictionary format with keys being the metric name - "mean","stdev","kurtosis" and value being the weightage of the metric (between 0 and 1). Sum of all weightages must be 1. (Default value = {"mean": 0.5, "stddev": 0.3, "kurtosis": 0.2})
binary_cols- List of numerical columns to be treated as binary columns e.g., ["col1","col2"]. Alternatively, columns can be specified in a string format, where different column names are separated by pipe delimiter “|”. For the specified binary columns, only the mean value will be used as the statistical metric (standard deviation and kurtosis will be skipped). In addition, standard deviation will be used to measure the stability of mean instead of CV. (Default value = [])
existing_metric_path- This argument is path for referring pre-existing metrics of historical datasets and is of schema [idx, attribute, mean, stdev, kurtosis]. idx is index number of historical datasets assigned in chronological order. (Default value = "")
appended_metric_path- This argument is path for saving input dataframes metrics after appending to the historical datasets' metrics. (Default value = "")
persist- Boolean argument - True or False. This argument is used to determine whether to persist on binning result of source and target dataset, True will enable the use of persist, otherwise False. It is recommended to set this as True for large datasets. (Default value = True)
persist_option- If persist is True, this argument is used to determine the type of persist. (Default value = pyspark.StorageLevel.MEMORY_AND_DISK)
threshold- A column is flagged if the stability index is below the threshold, which varies between 0 to 4. The following criteria can be used to classifiy stability_index (SI): very unstable: 0≤SI<1, unstable: 1≤SI<2, marginally stable: 2≤SI<3, stable: 3≤SI<3.5 and very stable: 3.5≤SI≤4. (Default value = 1)
print_impact- True, False (Default value = False) This argument is to print out the stability metrics of all attributes and potential unstable attributes.
Returns
DataFrame- [attribute, mean_stddev, mean_si, stddev_si, kurtosis_si, mean_cv, stddev_cv, kurtosis_cv, stability_index]. _cv is coefficient of variation for each metric. _si is stability index for each metric. stability_index is net weighted stability index based on the individual metrics' stability index.
Expand source code
def stability_index_computation(
    spark,
    idfs,
    list_of_cols="all",
    drop_cols=[],
    metric_weightages={"mean": 0.5, "stddev": 0.3, "kurtosis": 0.2},
    binary_cols=[],
    existing_metric_path="",
    appended_metric_path="",
    persist: bool = True,
    persist_option=pyspark.StorageLevel.MEMORY_AND_DISK,
    threshold=1,
    print_impact=False,
):
    """
    The data stability is represented by a single metric to summarise the stability of an attribute over multiple
    time periods. For example, given 6 datasets collected in 6 consecutive time periods (D1, D2, …, D6),
    data stability index of an attribute measures how stable the attribute is from D1 to D6.

    The major difference between data drift and data stability is that data drift analysis is only based on 2
    datasets: source and target. However data stability analysis can be performed on multiple datasets. In addition,
    the source dataset is not required indicating that the stability index can be directly computed among multiple
    target datasets by comparing the statistical properties among them.

    In summary, given N datasets representing different time periods, we would like to measure the stability of some
    numerical attributes from the first to the N-th dataset.

    The whole process can be broken down into 2 steps: (1) Choose a few statistical metrics to describe the
    distribution of each attribute at each time period. (2) Compute attribute level stability by combining the
    stability of each statistical metric over time periods.

    In the first step, we choose mean, standard deviation and kurtosis as the statistical metrics in our
    implementation. Intuitively, they represent different aspects of a distribution: mean measures central tendency,
    standard deviation measures dispersion and kurtosis measures shape of a distribution. Reasons of selecting those
    3 metrics will be explained in a later section. With mean, standard deviation and kurtosis computed for each
    attribute at each time interval, we can form 3 arrays of size N for each attribute.

    In the second step, Coefficient of Variation (CV) is used to measure the stability of each metric. CV represents
    the ratio of the standard deviation to the mean, which is a unitless statistic to compare the relative variation
    from one array to another. Considering the wide potential range of CV, the absolute value of CV is then mapped to
    an integer between 0 and 4 according to the table below, where 0 indicates highly unstable and 4 indicates highly
    stable. We call this integer a metric stability index.

    | abs(CV) Interval | Metric Stability Index |
    |------------------|------------------------|
    | [0, 0.03)        | 4                      |
    | [0.03, 0.1)      | 3                      |
    | [0.1, 0.2)       | 2                      |
    | [0.2, 0.5)       | 1                      |
    | [0.5, +inf)      | 0                      |


    Finally, the attribute stability index (SI) is a weighted sum of 3 metric stability indexes, where we assign 50%
    for mean, 30% for standard deviation and 20% for kurtosis by default. The final output is a float between 0 and 4 and an
    attribute can be classified as one of the following categories: very unstable (0≤SI<1), unstable (1≤SI<2),
    marginally stable (2≤SI<3), stable (3≤SI<3.5) and very stable (3.5≤SI≤4).

    For example, there are 6 samples of attribute X from T1 to T6. For each sample, we have computed the statistical
    metrics of X from T1 to T6:

    | idx | Mean | Standard deviation | Kurtosis |
    |-----|------|--------------------|----------|
    | 1   | 11   | 2                  | 3.9      |
    | 2   | 12   | 1                  | 4.2      |
    | 3   | 15   | 3                  | 4.0      |
    | 4   | 10   | 2                  | 4.1      |
    | 5   | 11   | 1                  | 4.2      |
    | 6   | 13   | 0.5                | 4.0      |

    Then we calculate the Coefficient of Variation for each array:

    - CV of mean = CV([11, 12, 15, 10, 11, 13]) = 0.136
    - CV of standard deviation = CV([2, 1, 3, 2, 1, 0.5]) = 0.529
    - CV of kurtosis = CV([3.9, 4.2, 4.0, 4.1, 4.2, 4.0]) = 0.027

    Metric stability indexes are then computed by mapping each CV value to an integer accordingly. As a result,
    metric stability index is 2 for mean, 0 for standard deviation and 4 for kurtosis.

    Why mean is chosen over median?

    - Dummy variables which take only the value 0 or 1 are frequently seen in machine learning features. Mean of a
    dummy variable represents the proportion of value 1 and median of a dummy variable is either 0 or 1 whichever is
    more frequent. However, CV may not work well when 0 appears in the array or the array contains both positive and
    negative values. For example, intuitively [0,0,0,0,0,1,0,0,0] is a stable array but its CV is 2.83 which is
    extremely high, but cv of [0.45,0.44,0.48,0.49,0.42,0.52,0.49,0.47,0.48] is 0.06 which is much more reasonable.
    Thus we decided to use mean instead of median. Although median is considered as a more robust choice,
    outlier treatment can be applied prior to data stability analysis to handle this issue.

    Why kurtosis is chosen over skewness?

    - Kurtosis is a positive value (note that we use kurtosis instead of excess kurtosis which) but skewness can
    range from –inf to +inf. Usually, if skewness is between -0.5 and 0.5, the distribution is approximately
    symmetric. Thus, if the skewness fluctuates around 0, the CV is highly likely to be high or invalid because the
    mean will be close to 0.

    Stability index is preferred in the following scenario:

    - Pairwise drift analysis can be performed between the source dataset and each of the target dataset to quantify
    the drift over time. However this can be time-consuming especially when the number of target dataset is large. In
    this case, measuring data stability instead of data drift would be a much faster alternative and the
    source/baseline dataset is not required as well

    Troubleshooting

    - If the attribute stability index appears to be nan, it may due to one of the following reasons: - One metric (
    likely to be kurtosis) is nan. For example, the kurtosis of a sample is nan If its standard deviation is 0. - The
    mean of a metric from the first to the N-th dataset is zero, causing the denominator of CV to be 0. For example,
    when mean of attribute X is always zero for all datasets, its stability index would be nan.

    Limitation

    - Limitation of CV: CV may not work well when 0 appears in the array or the array contains both positive and
    negative values.

    Parameters
    ----------
    spark
        Spark Session
    idfs
        Variable number of input dataframes
    list_of_cols
        List of numerical columns to check stability e.g., ["col1","col2"].
        Alternatively, columns can be specified in a string format,
        where different column names are separated by pipe delimiter “|” e.g., "col1|col2".
        "all" can be passed to include all numerical columns for analysis.
        Please note that this argument is used in conjunction with drop_cols i.e. a column mentioned in
        drop_cols argument is not considered for analysis even if it is mentioned in list_of_cols. (Default value = "all")
    drop_cols
        List of columns to be dropped e.g., ["col1","col2"].
        Alternatively, columns can be specified in a string format,
        where different column names are separated by pipe delimiter “|” e.g., "col1|col2". (Default value = [])
    metric_weightages
        Takes input in dictionary format with keys being the metric name - "mean","stdev","kurtosis"
        and value being the weightage of the metric (between 0 and 1). Sum of all weightages must be 1.
        (Default value = {"mean": 0.5, "stddev": 0.3, "kurtosis": 0.2})
    binary_cols
        List of numerical columns to be treated as binary columns e.g., ["col1","col2"].
        Alternatively, columns can be specified in a string format, where different column names are
        separated by pipe delimiter “|”. For the specified binary columns,
        only the mean value will be used as the statistical metric (standard deviation and kurtosis will be skipped).
        In addition, standard deviation will be used to measure the stability of mean instead of CV.
        (Default value = [])
    existing_metric_path
        This argument is path for referring pre-existing metrics of historical datasets and is
        of schema [idx, attribute, mean, stdev, kurtosis].
        idx is index number of historical datasets assigned in chronological order. (Default value = "")
    appended_metric_path
        This argument is path for saving input dataframes metrics after appending to the
        historical datasets' metrics. (Default value = "")
    persist
        Boolean argument - True or False. This argument is used to determine whether to persist on
        binning result of source and target dataset, True will enable the use of persist, otherwise False.
        It is recommended to set this as True for large datasets. (Default value = True)
    persist_option
        If persist is True, this argument is used to determine the type of persist.
        (Default value = pyspark.StorageLevel.MEMORY_AND_DISK)
    threshold
        A column is flagged if the stability index is below the threshold, which varies between 0 to 4.
        The following criteria can be used to classifiy stability_index (SI): very unstable: 0≤SI<1,
        unstable: 1≤SI<2, marginally stable: 2≤SI<3, stable: 3≤SI<3.5 and very stable: 3.5≤SI≤4. (Default value = 1)
    print_impact
        True, False (Default value = False)
        This argument is to print out the stability metrics of all attributes and potential unstable attributes.

    Returns
    -------
    DataFrame
        [attribute, mean_stddev, mean_si, stddev_si, kurtosis_si, mean_cv, stddev_cv, kurtosis_cv, stability_index].
        *_cv is coefficient of variation for each metric. *_si is stability index for each metric.
        stability_index is net weighted stability index based on the individual metrics' stability index.

    """

    num_cols = attributeType_segregation(idfs[0])[0]
    if list_of_cols == "all":
        list_of_cols = num_cols
    if isinstance(list_of_cols, str):
        list_of_cols = [x.strip() for x in list_of_cols.split("|")]
    if isinstance(drop_cols, str):
        drop_cols = [x.strip() for x in drop_cols.split("|")]
    if isinstance(binary_cols, str):
        binary_cols = [x.strip() for x in binary_cols.split("|")]

    list_of_cols = list(set([e for e in list_of_cols if e not in drop_cols]))

    if any(x not in num_cols for x in list_of_cols) | (len(list_of_cols) == 0):
        raise TypeError("Invalid input for Column(s)")

    if any(x not in list_of_cols for x in binary_cols):
        raise TypeError("Invalid input for Binary Column(s)")

    check_metric_weightages(metric_weightages)
    check_threshold(threshold)

    if existing_metric_path:
        existing_metric_df = spark.read.csv(
            existing_metric_path, header=True, inferSchema=True
        )
        dfs_count = int(existing_metric_df.select(F.max(F.col("idx"))).first()[0]) + 1
    else:
        existing_metric_df = None
        dfs_count = 1

    def unionAll(dfs):
        first, *_ = dfs
        return first.sql_ctx.createDataFrame(
            first.sql_ctx._sc.union([df.rdd for df in dfs]), first.schema
        )

    if persist:
        for i in range(len(idfs)):
            idfs[i] = idfs[i].select(list_of_cols)
            idfs[i].persist(persist_option)

    list_temp_all_col = []
    if appended_metric_path:
        list_append_all = []
    for i in list_of_cols:
        if i in binary_cols:
            col_type = "Binary"
        else:
            col_type = "Numerical"
        count_idf = dfs_count
        list_temp_col_in_idf = []
        for idf in idfs:
            df_stat_each = idf.select(
                F.mean(i).alias("mean"),
                F.stddev(i).alias("stddev"),
                (F.kurtosis(i) + F.lit(3)).alias("kurtosis"),
            )
            list_temp_col_in_idf.append(df_stat_each)
            if appended_metric_path:
                df_append_single = df_stat_each.select(
                    F.lit(str(count_idf)).alias("idx"),
                    F.lit(str(i)).alias("attribute"),
                    F.lit(col_type).alias("type"),
                    "mean",
                    "stddev",
                    "kurtosis",
                )
                list_append_all.append(df_append_single)
                count_idf += 1
        if existing_metric_df:
            existing_df_for_single_col = existing_metric_df.where(
                F.col("attribute") == str(i)
            ).select("mean", "stddev", "kurtosis")
            if existing_df_for_single_col.count() > 0:
                list_temp_col_in_idf.append(existing_df_for_single_col)
        df_stat_col = (
            unionAll(list_temp_col_in_idf)
            .select(
                F.stddev("mean").alias("std_of_mean"),
                F.mean("mean").alias("mean_of_mean"),
                F.stddev("stddev").alias("std_of_stddev"),
                F.mean("stddev").alias("mean_of_stddev"),
                F.stddev("kurtosis").alias("std_of_kurtosis"),
                F.mean("kurtosis").alias("mean_of_kurtosis"),
            )
            .select(
                F.lit(str(i)).alias("attribute"),
                F.lit(col_type).alias("type"),
                F.col("std_of_mean").alias("mean_stddev"),
                (F.col("std_of_mean") / F.col("mean_of_mean")).alias("mean_cv"),
                (F.col("std_of_stddev") / F.col("mean_of_stddev")).alias("stddev_cv"),
                (F.col("std_of_kurtosis") / F.col("mean_of_kurtosis")).alias(
                    "kurtosis_cv"
                ),
            )
        )
        list_temp_all_col.append(df_stat_col)
    odf = unionAll(list_temp_all_col)
    if appended_metric_path:
        if existing_metric_df:
            list_append_all.append(existing_metric_df)
        df_append = unionAll(list_append_all).orderBy(F.col("idx"))
        df_append.coalesce(1).write.csv(
            appended_metric_path, header=True, mode="overwrite"
        )

    f_compute_si = F.udf(compute_si(metric_weightages), T.ArrayType(T.FloatType()))

    odf = (
        odf.replace(np.nan, None)
        .withColumn(
            "si_array",
            f_compute_si("type", "mean_stddev", "mean_cv", "stddev_cv", "kurtosis_cv"),
        )
        .withColumn("mean_si", F.col("si_array").getItem(0))
        .withColumn("stddev_si", F.col("si_array").getItem(1))
        .withColumn("kurtosis_si", F.col("si_array").getItem(2))
        .withColumn("stability_index", F.col("si_array").getItem(3))
        .withColumn(
            "flagged",
            F.when(
                (F.col("stability_index") < threshold)
                | (F.col("stability_index").isNull()),
                1,
            ).otherwise(0),
        )
        .withColumn("mean_stddev", F.round(F.col("mean_stddev"), 4))
        .withColumn("mean_cv", F.round(F.col("mean_cv"), 4))
        .withColumn("stddev_cv", F.round(F.col("stddev_cv"), 4))
        .withColumn("kurtosis_cv", F.round(F.col("kurtosis_cv"), 4))
        .drop("si_array")
    )

    if print_impact:
        logger.info("All Attributes:")
        odf.show(len(list_of_cols))
        logger.info("Potential Unstable Attributes:")
        unstable = odf.where(F.col("flagged") == 1)
        unstable.show(unstable.count())

    if persist:
        for i in range(len(idfs)):
            idfs[i].unpersist()

    return odf